// PROJECT SUMMARY
IMPOL already had a sophisticated simulation tool capable of predicting grain size and shape based on different process parameters. However, its output consisted of large CSV datasets containing millions of data points — useful for computation, but extremely difficult for a person to interpret intuitively.
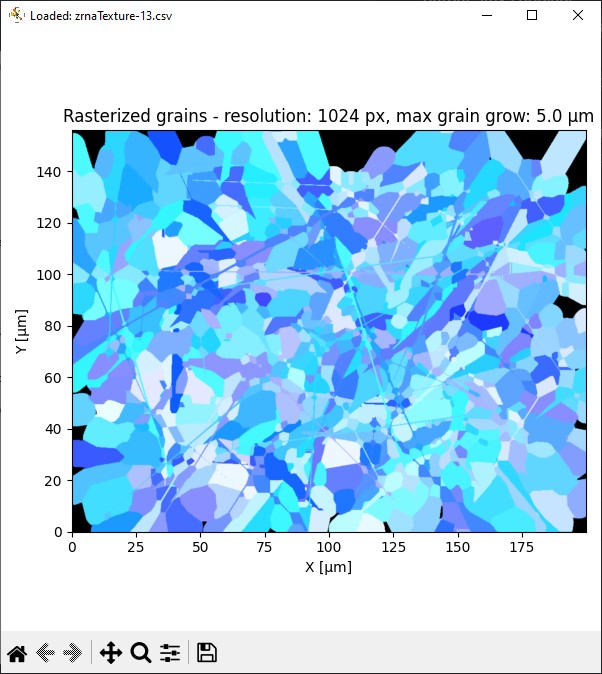
JPM Systems developed custom visualization software that transforms this numerical output into a visual representation of the predicted material structure within seconds.
// THE PROBLEM
Simulation and prediction models can generate extremely valuable data, but data alone does not necessarily provide insight.
IMPOL's existing tool generated CSV files several megabytes in size describing predicted grains and their properties. While the underlying information was available, understanding the resulting material structure directly from thousands of numerical values was practically impossible.
The goal was to transform this raw simulation data into a visual representation that engineers and researchers could understand immediately.
This introduced another significant computational challenge: the individual grains had to be positioned on a 2D plane while preserving their characteristics and minimizing the empty space between them.
// THE SOLUTION
We developed a custom software application for scientific data visualization that reads the simulation output and automatically generates a visual representation of the predicted grain structure.
Instead of analyzing large CSV files manually, users can see the resulting structure and visually evaluate the predicted material characteristics.
A major part of the development was creating an efficient method for positioning and packing large numbers of irregular grains into the visualization.
The result is a computationally efficient tool that can process complex datasets and generate the visualization within seconds, even on an older standard laptop.
// OUR WORK
JPM Systems was responsible for:
- – Custom software development
- – Software architecture
- – Scientific data visualization
- – Processing of large CSV datasets
- – Data transformation and interpretation
- – Development of grain placement and packing logic
- – Algorithm research and evaluation
- – Computational performance optimization
- – Visualization engine development
- – User interface development
- – Testing and validation
// KEY CHALLENGES
Turning Numerical Data into Visual Insight
The original simulation provided detailed numerical information about individual grains, but the output was not something a person could intuitively interpret.
Our first challenge was therefore to translate this mathematical representation into a visualization that preserves the important characteristics of the simulation while making the result immediately understandable.
The Packing Problem
Visualizing individual grains required determining how thousands of shapes should be positioned together on a two-dimensional plane with minimal empty space between them.
This is a complex computational geometry and packing problem. The number of possible arrangements grows rapidly as the number of objects increases, making straightforward approaches computationally expensive.
Performance Optimization
We implemented and evaluated state-of-the-art packing approaches, but with real-world datasets the processing requirements were still too high. Generating a visualization took too long and required too much computational power for a practical desktop application.
We therefore developed a different optimization approach specifically for this problem.
The details of the method remain proprietary, but the difference in performance is significant: datasets that presented a major computational challenge can now be visualized on an older laptop, with results appearing within seconds.
Making Advanced Computation Practical
A technically correct algorithm is not enough if users have to wait too long for a result.
An important part of the project was therefore not simply developing the visualization, but engineering the complete processing pipeline so that it could be used interactively on ordinary computer hardware without requiring specialized high-performance computing infrastructure.
// THE RESULT
IMPOL's complex simulation output was transformed from large numerical datasets into an interactive and intuitive visual representation of predicted grain structures.
Engineers can now move from simulation data to visual insight in seconds, making it significantly easier to understand and evaluate predicted material structures.
The project demonstrates how custom software development, data visualization and algorithm optimization can turn an existing scientific model into a practical engineering tool — and how solving the computational bottleneck can be just as important as creating the visualization itself.